An inverted Treasury yield curve has historically been one of Wall Street’s most reliable recession indicators. But it has been flashing for more than a year now, with few signs of an economic slowdown in sight.
However, according to a Wall Street economist, the situation could soon change.
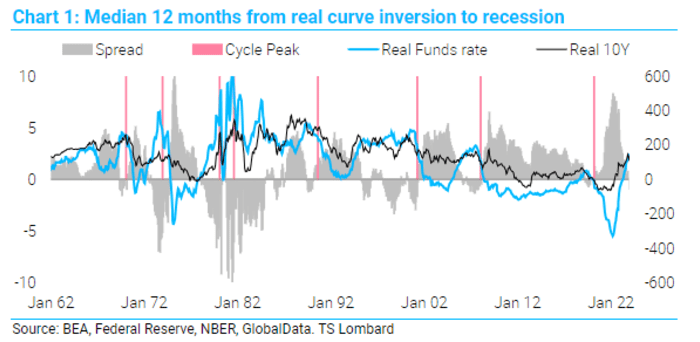
While the nominal yield curve has inverted since 2022, the real yield curve has inverted for only the first time since the Fed began its latest rate-hiking cycle last month, according to Steve Blitz, chief U.S. economist at TSLombard.
Real yields are adjusted for inflation. The Treasury yield curve is a line drawn through the yields of all Treasury maturities. Typically, yield curves are upward sloping, with investors demanding higher compensation for lending money over a longer period. An inverted curve occurs when the yield on short-term maturities exceeds the yields on longer-dated maturities.
Assuming a recession eventually materializes, that could help explain why an indicator that preceded every recession since the 1960s — including, as it would turn out, the surprise COVID-19-induced recession in 2020 — seemed to fail.
Previously, the nominal and real yield curves inverted almost simultaneously. But this time more than a year has passed between them, Blitz said.
“What happened to the yield curve as a predictor? Simply put, in previous cycles the nominal and real yield curves generally moved in sync, so there was no need to differentiate,” Blitz said in a note to clients shared with MarketWatch on Thursday.
“This time, the nominal curve inverted a year ago, but the real curve only inverted in January. The real curve matters more because recessions occur more predictably after inversion,” she wrote.
TLOMBARDO
The Blitz report comes at a time when real interest rates have been a key issue for market watchers and economists. Late last month, a Wall Street Journal report warned that the Fed faced a new dilemma by keeping interest rates high with inflation falling.
The risk, according to the report, is that a rapid easing of inflation could cause short-term real rates to rise, potentially increasing pressure on the economy if the Fed does not lower interest rates accordingly.
Inflation has fallen rapidly since reaching its fastest rate in four decades during the summer of 2022. According to the December PCE Price Index, the Federal Reserve’s preferred inflation indicator, shows that the rate of Core inflation has slowed to 1.9% annualized over the past six years. months.
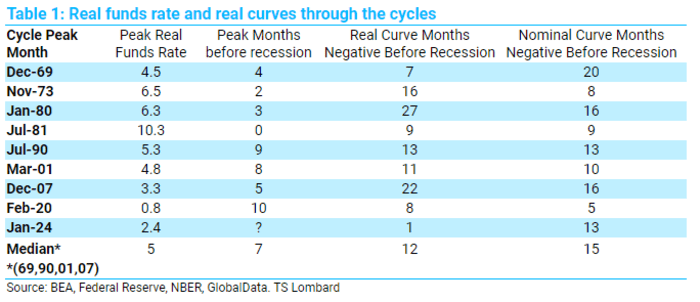
According to Blitz data, the median time it takes for a U.S. recession to begin following a reversal in real interest rates is 12 months, compared to 15 months for the nominal yield curve. If so, the recession is expected to begin in late 2024 or early 2025.
TLOMBARDO
Dow Jones market data shows that the yield on three-month Treasury bills, which is roughly equivalent to the effective federal funds rate, has been higher than the yield on 10-year Treasuries as of November 8, 2022 – about 15 months.
This is the longest stretch of uninterrupted inversion dating back to 1989, the earliest data available. But the spread between the two-year and 10-year yields remained inverted for even longer, starting in July 2022.
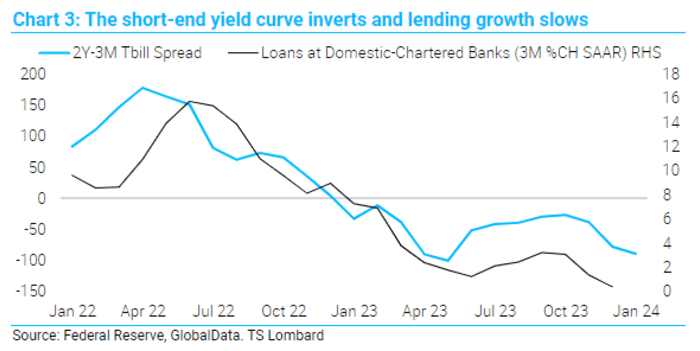
An inverted yield curve has caused loan growth in the U.S. economy to slow to virtually zero, Blitz said. But now that the real yield curve has inverted, the rate of change in lending by US banks could soon turn negative. Banks that reduce their loan portfolios, rather than holding them constant or increasing them, would deal a severe blow to the real economy.
TLOMBARDO
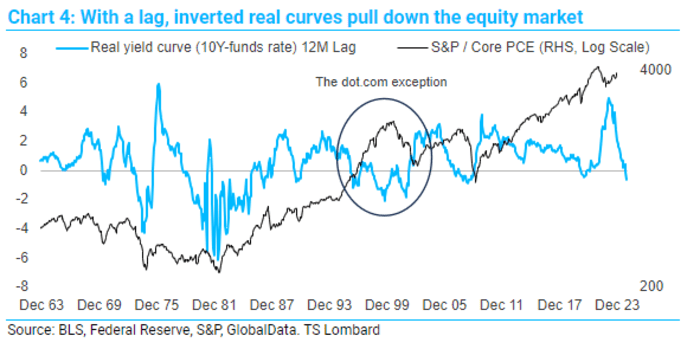
The inversion of the real yield curve could also harm the stock market, Blitz pointed out, once again citing historical data.
“Inverted real curves have a lagged negative impact on the stock market – unsurprisingly about 12 months later, the same median duration from real inversion to recession,” he said.
TLOMBARDO
To find an example that reflected the circumstances the Fed now finds itself in, Blitz had to go back to the late 1960s and the policy decisions that led to a recession in late 1969. Then, the real curve only turned negative. after the nominal curve had been inverted for 13 months.
The fact that this episode was followed by the great inflation of the 1970s suggests that the Fed is justified in wanting more evidence that inflation is moving back toward its 2% target, Blitz said.
The nominal yield curve inverted slightly on Thursday, with the three-month Treasury yield BX:TMUBMUSD03M moving slightly lower, while the 10-year Treasury yield BX:TMUBMUSD10Y rose 4 points basis at 4.16%.
US stocks looked set to close higher on Thursday, with the S&P 500 SPX rising 0.1% to 4,997, leaving the index on the verge of breaking above 5,000 for the first time ever. Meanwhile, the Dow Jones Industrial Average DJIA gained 30 points, or 0.1%, to 38709. The Nasdaq Composite COMP rose 0.3% to 15,800.